

In this article we will show you how to make a data table in google docs, Google Docs is a highly useful word processor some believe it is even better than Microsoft word. Google has added more sophisticated formatting, editing, and markup features to Docs.
Google focuses on the features that everyone uses daily rather than adding tons of features that no one uses.
Google Docs is free to use, web-based word processor. Adding a table in your document is a good option when you want to show data or images.
A table provides a structured way to show data. It also improves the overall appearance and understanding of the matter.
Adding a table in Google Docs is very easy and can be done just in a few clicks. Let’s see how!
Step By Step Guide On How To Make A Data Table In Google Docs :-
Tables are very useful when you want to create a form, align text, numbers, and Graphics. Given below are steps using which you can add a table in Google Docs. We have also explained how you can edit the properties of the table.
- Open Google Docs by searching for the same in your web browser. Google Docs can also be used on Smartphones and tablets, You can access Google docs on your Smartphone or Tablet through the Web browser and also by downloading the app from the Playstore or Appstore.
- If you want to edit an existing document then login to your google drive and select the document you want to edit from there.
-
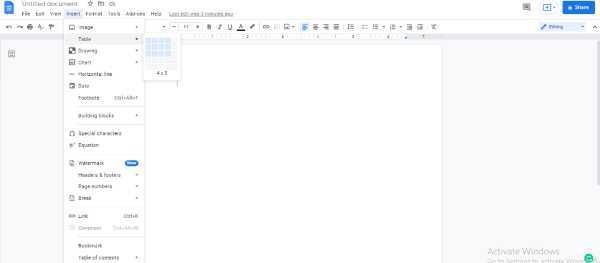
After Opening Google Docs navigate and put your cursor to where you want to add a table. Type “@” to open the insert menu, scroll down in the menu to find Table, and click. You can also insert the table by clicking on the Insert option from the toolbar.

-
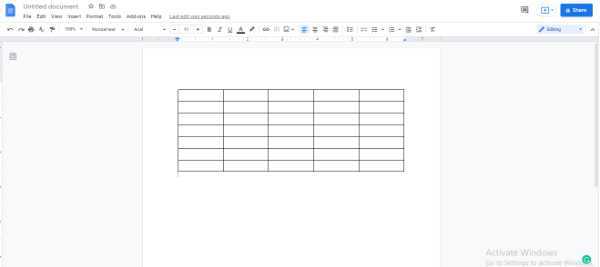
Now select the number of rows and columns you want to add to your table. Click after selecting the number of rows and columns and your table will be placed into your desired spot.
-
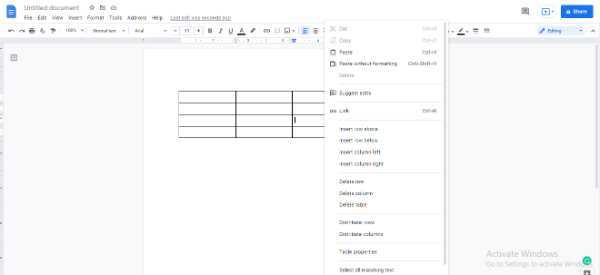
You can edit the number of rows and columns by clicking on the table, in the opened menu you will get the option to add or remove the rows and columns. You will also see an option to delete the whole table.
- It is also possible to resize and edit other properties of the rows and columns. To resize place the cursor on the border of the row or column and click when you see the double-sided arrow. Now drag the cursor along the line to adjust the size.
Conclusion :-
Tables are a great way to explain the data and analytics properly. It helps to structure the contents in a proper way. I hope this article on how to make a data table in google docs helps you.