

In this article we will show you how to edit a chart in google docs, while creating documents, reports, and spreadsheets In Google Docs, inserting a chart can be really beneficial for the users as it provides a more clear visual of your data.
When you insert a chart in your Google docs, you can easily include your own data in a more organized manner and make a few of the amends as per your own choice.
Google docs provide the direct feature of inserting per chat into your document where you can easily include your data. you can also edit your charge in Google dogs that are handy to use by changing its color, adjusting the size to make it brighter.
In case you are looking for a solution on how to edit a chart in Google Docs, this is the right article for you.
Step By Step Guide On How To Edit A Chart In Google Docs :-
- Open Google Docs on your PC.
- Make sure you are logged into your account. In case you are not logged in to your account, simply enter your valid email id along with your password.
- Now open the specific document that includes the charts in Google Docs.
- In case you do not have any document consisting of a chart, you can easily create a new chat with the help of the insert tab.
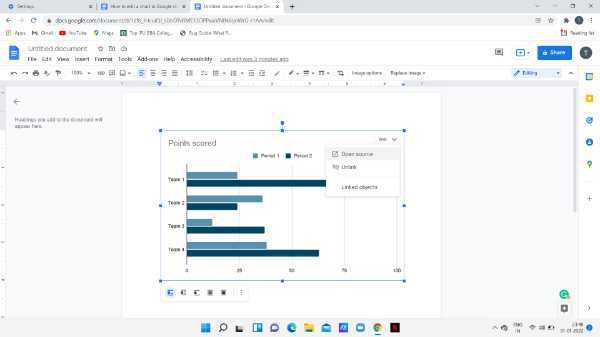
- Now after opening the document, select your chart by simply tapping it in Google Docs.
- Click the linked chart options placed at the top right corner of the screen. It is represented by the link and downward Arrow icon.
- It will show options like unlink, open source, and linked objects.
-
Click the option of open source from the drop-down list.
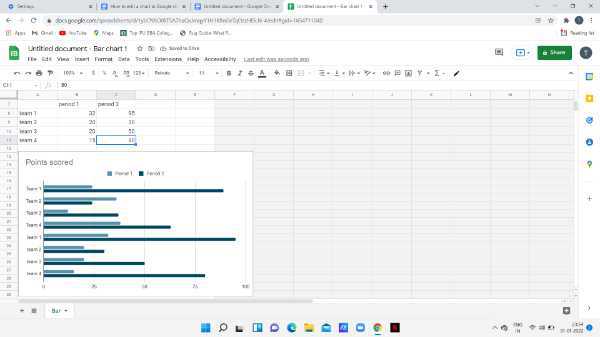
- After clicking this option A Google sheet will open in a new window which include the data of the selected chart.
- Use the cell located above the chart in order to edit the data as per your own choice.
-
Enter the values that you want to edit in the chat placed in your Google docs.
- After entering all the values simply go back to your Google Docs document again and select the chart.
-
Now click on the update option placed at the top right corner of the selected chart in Google Docs.

-
As you can see in the picture given below the data is changed as per the values entered.
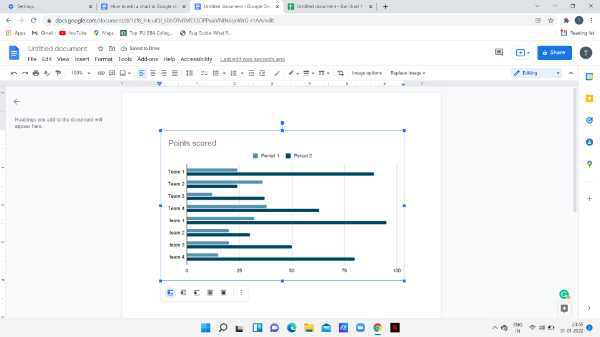
- This way you can easily added the chart and customize it as per your own need.
Conclusion :-
I hope this article on how to edit a chart in google docs helps you, in this article we covered an essential guide.