

In this article we will show you the solution of how to analyze large data sets in excel, MS Excel is a popular spreadsheet app that was developed by Microsoft for different devices, like Android, Mac and Windows.
With the help of Excel, it becomes very convenient to perform different tasks involving data entry, record keeping and data management.
We can also perform different kinds of calculations with the help of Excel. Another very important feature of Excel is the Pivot Table.
If you frequently use Excel, then you must be familiar with how you can use Pivot Table for your functions.
But for large amount of data, you will need to use a stronger tool, called Power Pivot. In this article we shall learn how to use Power Pivot to analyse large sets of data in MS Excel.
Step By Step Guide On How To Analyze Large Data Sets In Excel :-
The Power Pivot tool is free to use, at it is a built-in feature in MS Excel that was added in its 2016 version and onwards.
Follow the steps given below to activate the power pivot table:
- Open MS Excel on your device.
- Next, click on “file” from the menu bar at the top of the screen.

- Scroll down towards the bottom of the screen
- Click on “options” present near the bottom of the screen

- You will see that a new page has opened.
- Now, click on the “add-ins” option:
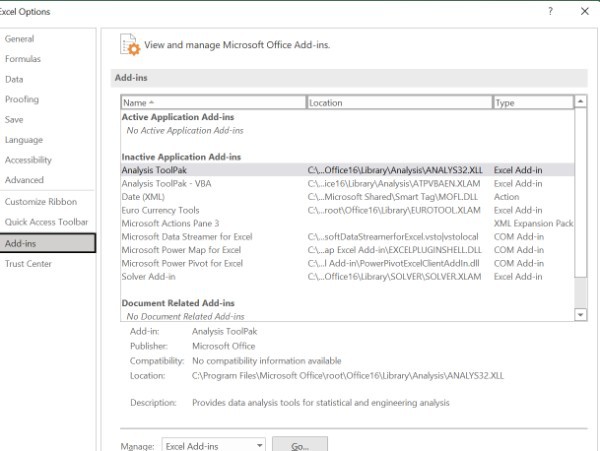
- Now, go to the manage section.
- From there, click on COMS Add-ins option.
- Then click on Go.
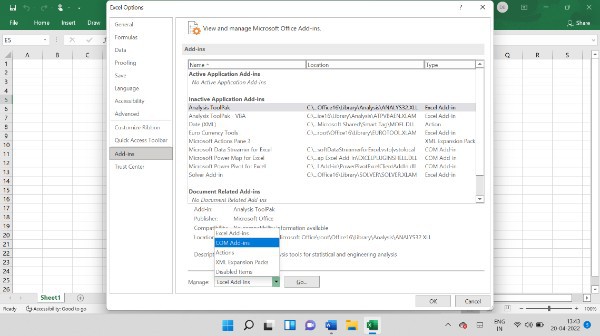
- Then, you will see a new dialogue box appearing on your screen.
- From there, click on the “Microsoft Power Pivot for Excel”.
- Finally, click on OK.

- Your new Power pivot ribbon is now ready for use.

Now that you have added up the Power Pivot ribbon to your Excel, let us now see how you can use for your Excel sheets.
- Open the Excel sheets that you want to work on.
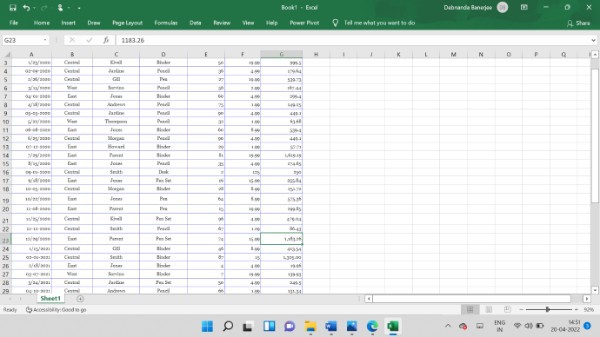
- Now, open up a new page on MS Excel.
- Then, in the new Excel page, click on the Power Pivot towards the top of the screen.
- Next, click on the “Manage Data” option

- Next, click on the “Get External Data” option.
- From there, click on the “From Other Sources” option.

- A new box will appear and you will need to search for the Excel file option.

- Click on the “Excel File” option.
- Then change the name of the Friendly Connection space according to the name of the file that you are working on.
- Finally, click Finish.
Conclusion :-
This way, you can easily analyse large sets of data using power pivot tool. With the help of this tool, you can also create tables and graphs to show different values or tables of data.
Now you can analyse large sets of data in MS Excel without fearing about your device crashing.
I hope this article on how to analyze large data sets in excel helps you and the steps and method mentioned above are easy to follow and implement.